Recently, we encountered a very good article about another instance of the Kelihos botnet. According to results of research conducted by the author, most of the machines involved in the fast-flux network scheme are located in Poland. That’s why we decided to take a closer look at available samples of malicious software and share our findings.
Kelihos.B
For starters let’s briefly characterize the botnet. This is another variant (B) of known spamming botnet. The instance consisting of machines infected with A variant (hereinafter referred to as Kelihos.A) of the malicious software was taken down by a team of Microsoft, Kaspersky Lab. and Kyrus Tech in September last year. Kelihos possesses a CC channel through which it receives orders from botmasters. Anyone who has access to the CC channel (e.g. owns it), controls this powerful botnet. In the case of Kelihos.A CC channel consisted of two parts (sub-channels): P2P network and set of web servers. The team attacked both sub-channels. Using a variety of Sybil attack they managed to forge false identities for P2P networks, which distributed among the bots crafted information on servers in the second sub-channel. In this way, the team managed to take control of both sub-channels, not giving botmasters time to update the current bot software and build a new channel. The team actually took control of the botnet and redirected requests for orders to the so-called sinkhole (most likely requests are ignored or orders to remain inactive are given). Botnet discovered in late January of this year (Kelihos.B) is new and has a new, separate CC channel.
During our analysis Kelihos.B bot, part of another instance of the Kelihos botnet, we came across an interesting security feature that we decided to describe in this article.
The exception
When debugging a bot program the main thread generated an exception number 0xc0000005 – Access Violation 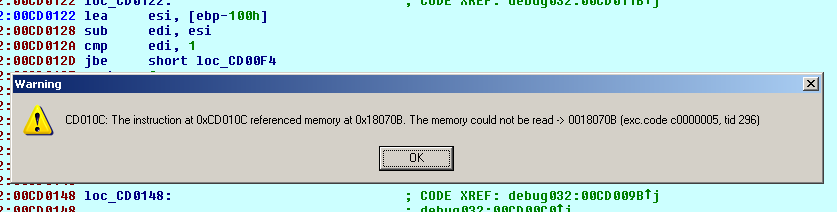 , which interrupted the execution. Throwing an exception is a way of communicating with other parts of the program, with the processor and operating system. The exception in general is a signal which is passed to the application when an event that require its attention occured (exceptional situation). Imagine a situation when the processor encounters a divide-by-zero instruction. What should it do? It can not execute this instruction, but there are several other possibilities. It can ignore this instruction and proceed to the next. However, the above will almost certainly result in further errors. Stopping execution means suspension of the entire operating system (and inform the user, generating so called bug check, well known to Windows users Blue Screen) or simply turning off the computer. There is also a third option: the processor can stop at this moment, inform the software about exceptional situation and ask what it should do. This is how exception handling functions work. The operating system uses CPU interruption mechanisms to provide the developer with a flexible way to deal with such exceptional situations. The processor can generate an interrupt (which can be regarded as a primitive form of an exception), which is first passed to the operating system. The operating system checks if it should handle this interrupt (most of hardware interrupts for example), or whether it should pass the information to the application to which belongs the code being executed. If it opts for a second option, it generates an exception and passes it to the application. Developer can install in his application a number (a chain) of exception handlers. They can pass the exception among themselves and decide on the execution of other parts of the program, which will be way out of the situation. If none of the procedures can not resolve the problem, the exception is passed back to the operating system (calling kernel32!UnhandledExceptionFilter), and this in turn will cause termination of the application.
Some developers (not just creators of botnets) use a system of exceptions to protect their programs against various types of analysis (botmaster protects his code from the law enforcement, author of a game protects it from a cracker). They install in their application an exception handler, which contains important instructions for the implementation of the program. For example, an exception handler needs to be executed for the game to be launched. Then they generate an error that will trigger the exception and, consequently, will launch the installed procedure (as was the case in Waledac bot). The following code shows the exemplary installation of an exception handler:
push esi
push dword ptr fs:[0]
mov dword ptr fs:[0], esp
The program then produces an exception, for example, attempts to read value from address 0x0:
mov eax, [eax]
After this instruction, the processor will generate an interrupt, which will be sent to the application in the form of an exception. The application will launch the handler and execute exception_handler protected instructions.
This scheme can be used to protect code in many ways. When we discovered that the bot generated a memory access volation exception, as experienced analysts we immediately started to browse the list of installed exception handlers in order to analyze them. However, the list was empty =). After exception is passed to the application, it’s passed back to the operating system, which terminates its operation (with no additional VEH procedures registered and default UnhandledExceptionFilter). We realized that this is more sophisticated protection and to continue the analysis we needed to take a closer look at it.
The protection
First, let’s look at the statement that caused the exception: lodsw
It is an attempt to access a memory area that’s not readable for the application. At first glance, looks like a regular error, perhaps due to incompatibility with the operating system or damaged code. However, we compared execution of the program with an attached debugger with the execution without the debugger. In the case of the debugger detached program works fine, connects to other members of the P2P networks, serves reports to the CC, receives orders and starts sending spam 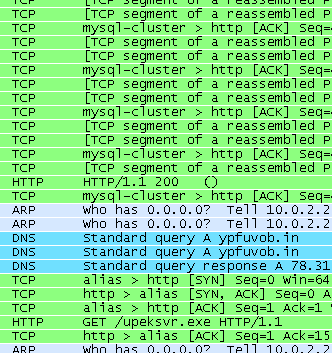
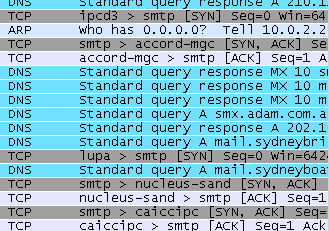 . So the execution of the program is dependent on the changes introduced by the debugger.
This protection feature pretends to be a bug and protection mechanisms pretending to be errors are the most sophisticated protection. A program can include various types of security procedures, checking passwords and serial numbers, or even hardware keys. However, although they are hidden from the ordinary user, for an analyst, armed with his tools, they are visible, and their evasion requires nothing more than changes in the registry or a flag of the processor. But when security is dressed as a runtime error, things get worse. In this case, it is necessary to reach the sources of error, which may be in a different place in the program, may be placed in a complex logic structure, hierarchy of control loops and conditionals, and above all very dependent on the environment of the program. In our case the error is generated by the changes introduced by the debugger to the application’s execution environment, as proved by a simple test – running the bot with and without a debugger. Some types of protection mechanisms raise this scheme to the level of mathematical functions of code dependent on the environment – the code encrypted with elements of the environment. To understand this mechanism we have to get to the changes in the environment made by the debugger. And there are many of these: heap flags, environmental flags, error codes, etc..
Let’s look again at lodsw instruction. It loads a word from the address pointed by ESI to AX register. And how come ESI contains the wrong address?
This is the context for this operation:
mov edx, [edx+0Ch] ; [2]
mov edx, [edx+0Ch] ; [3]
mov ebx, edx ; [4]
jmp short addr_1
loop_1:
mov edx, [edx] ; [8]
cmp edx, ebx
jz short addr_6
addr_1:
mov esi, [edx+30h] ; [5]
lea edi, [ebp-100h]
mov ecx, 100h
or esi, esi
jz short loop_1
loop_2:
lodsw ; [6] Access Violation
cmp al, 41h
jb short addr_3
cmp al, 5Ah
ja short addr_3
sub al, 0E0h
addr_3:
stosb
or al, al
jz short addr_4
dec ecx
jz short loop_1
jmp short loop_2
addr_4:
lea esi, [ebp-100h]
sub edi, esi
cmp edi, 1
jbe short loop_1
push 0
push esi
call near ptr addr_5
cmp eax, [ebp-104h]
jnz short loop_1 ; [7]
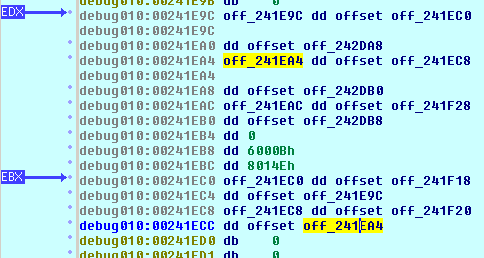
ESI at the time of an operation [6] contains value loaded by the instruction [5]. This value was taken from the address pointed by EDX + 0x30. This kind of pointer arithmetic is used to refer to a field of data structures (the beginning of the structure is pointed by EDX, and 0x30 is the offset of one of its fields). The value of the EDX register was established in [8]. Let’s take a look at this instruction:
It loads EDX with value that it now points to. This construction in loop is often used as an iterator in the algorithms using a list 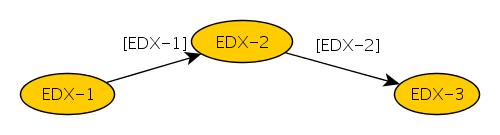 . So EDX register might be used in a loop loop_1 for iterating list items. Before entering the loop loop_1 this register is loaded in a sequence of operations [1], [2], [3], and then stored in EBX. To understand what types of structures are used in this algorithm, let’s start with the first instruction:
It loads into EDX from offset 0x30 in a memory segment pointed by the FS segment register (more specifically, the selector loaded into FS register). In Windows Applications FS points to the system TIB (Thread Information Block) structure. As you can check, the value of 0x30 points to the PEB (Process Environment Block) structure. It has been defined in the file winternl.h as follows:
BYTE Reserved1[2];
BYTE BeingDebugged;
BYTE Reserved2[1];
PVOID Reserved3[2];
PPEB_LDR_DATA Ldr;
PRTL_USER_PROCESS_PARAMETERS ProcessParameters;
BYTE Reserved4[104];
PVOID Reserved5[52];
PPS_POST_PROCESS_INIT_ROUTINE PostProcessInitRoutine;
BYTE Reserved6[128];
PVOID Reserved7[1];
ULONG SessionId;
} PEB, *PPEB;
Here we can find some environmental settings that can be modified by the debugger in order to introduce an error (the BeingDebugged name is self-explanatory =)). In line [2] EDX register is loaded with value from 0x0C offset from beginning of the structure. You can determine that this offset falls on the Ldr field: two bytes for Reserved1, one byte at BeingDebugged, one byte at Reserved2, two times four bytes for Reserved3 – together twelve (0x0C) bytes. Ldr field points to structure of type PPEB_LDR_DATA. Here’s its definition:
{
ULONG Length;
UCHAR Initialized;
PVOID SsHandle;
LIST_ENTRY InLoadOrderModuleList;
LIST_ENTRY InMemoryOrderModuleList;
LIST_ENTRY InInitializationOrderModuleList;
PVOID EntryInProgress;
} PEB_LDR_DATA, *PPEB_LDR_DATA;
In line [3] EDX is loaded with contents of InLoadOrderModuleList field, which is of type LIST_ENTRY.
Definition of LIST_ENTRY:
struct _LIST_ENTRY *Flink;
struct _LIST_ENTRY *Blink;
} LIST_ENTRY, *PLIST_ENTRY, *RESTRICTED_POINTER PRLIST_ENTRY;
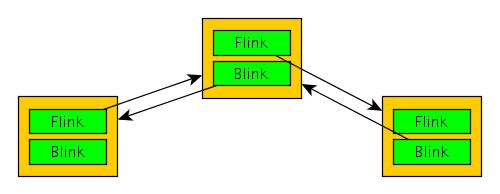
So, EDX points to the Flink field of LIST_ENTRY structure. This field points the next item on the cyclic linked LIST_ENTRY list. The next element is loaded by copying this value into EDX, which is performed, as already mentioned, by the instruction:
Pointer to the first element is stored in the EBX register in [4]. In loop loop_1 the program sequentially reads list items and compares pointers with the pointer to the first element. This way, when the list is over, and EDX again indicates the first element, the loop ends in [8].
Right, the program will look through the list of LIST_ENTRY elements. But these elements only contain pointers to the next and previous item, nothing more. Why do it then? Such a list is part of a construction, which Windows kernel developers use when creating lists of system objects, in many places the system (for example, to organize the table structure describing the driver list). Here’s how this structure is used.
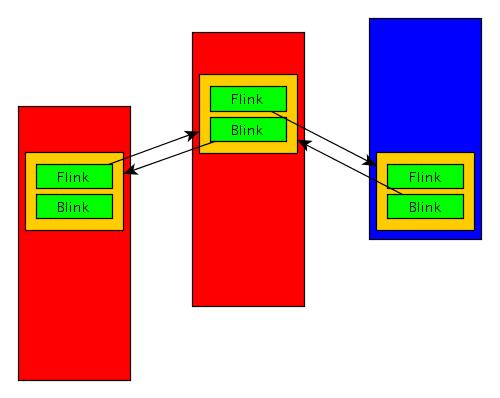
LIST_ENTRY components are placed inside the structures that they organize (as opposed to the more popular approach, placing pointers to structures inside elements of a list). This is a not very intuitive approach (and often is a cause of programming errors, as we shall see in a moment), however, it greatly simplifies the whole mechanism. Knowing one pointer from LIST_ENTRY element and knowing the definition of the structure in which it’s embedded, a program that needs access to any of the fields can apply simple pointer arithmetic to find them. The structure, which our LIST_ENTRY elements are located in is LIST_ENTRY LDR_MODULE:
{
LIST_ENTRY InLoadOrderModuleList;
LIST_ENTRY InMemoryOrderModuleList;
LIST_ENTRY InInitializationOrderModuleList;
PVOID BaseAddress;
PVOID EntryPoint;
ULONG SizeOfImage;
UNICODE_STRING FullDllName;
UNICODE_STRING BaseDllName;
ULONG Flags;
SHORT LoadCount;
SHORT TlsIndex;
LIST_ENTRY HashTableEntry;
ULONG TimeDateStamp;
} LDR_MODULE, *PLDR_MODULE;
In each iteration of the loop loop_1 we perform operations on the elements of LDR_MODULE structure. In particular, we refer to the field on an offset of 0x30 [5].
Each LIST_ENTRY takes two times four bytes, that’s 0x08. First three fields together are 0x18 bytes long. BaseAddress and EntryPoint field is another 0x08 bytes. SizeOfImage is 0x04 bytes. The next field contains the structure:
USHORT Length;
USHORT MaximumLength;
PWSTR Buffer;
} UNICODE_STRING;
The first two fields take 0x08 bytes and Buffer – 0x04. So, in [5] ESI is loaded with value from Buffer field of UNICODE_STRING structure. In C-language instruction, this operation could be:
PWSTR myBuffer = pModule->BaseDllName->Buffer;
Then, in [6], the program tries to read this value and at one point Access Violation exception is generated. So why the value in Buffer field is incorrect?
That’s because the structure in which currently loaded LIST_ENTRY is placed is not not a LDR_MODULE structure =). One of the elements has to be placed in PEB_LDR_DATA 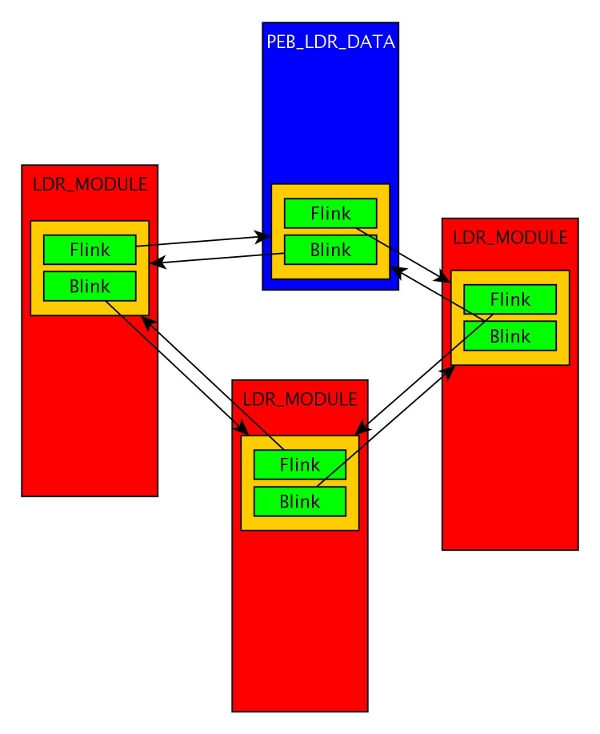 . When referring to that field, programmer makes a mistake (did we mention that it’s unintuitive? =)). Whatever is placed at 0x30 bytes offset from the start of the PEB_LDR_DATA structure, it’s almost certainy not a part of LDR_MODULE structure and not a proper string pointer.
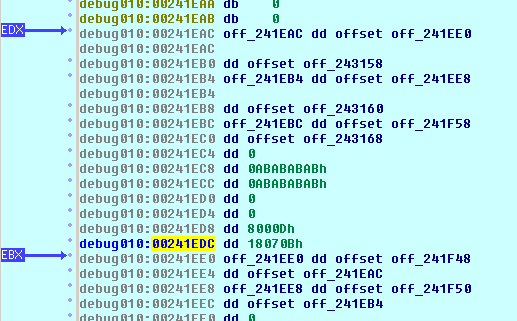
So, the algorithm implemented in Kelihos.B contains an error. But why does it sometimes cause an exception, which terminates the application, and sometimes not? To answer this question, we must return to the starting point and ask: what is the nature of environmental changes to the implementation of the program introduced by the debugger, that makes this error a reason to terminate the application?
If the program was started with attached debugger (i.e. in revised execution environment), many heap analysis mechanisms are being engaged. These mechanisms (we will not describe them in this article) facilitate the detection of various heap-related errors, including overflows. One symptom of this fact (and thus, a sign of the presence of a debugger) is placing in the selected memory locations hexadecimal strings: 0xABABABAB and 0xFEFEFEFE. This results in a change in offsets between certain structures contained in the memory. Incorrect reference to the Buffer field in [6] with these shifts will cause registers to be loaded with different values than without them. As a result, if a program is running without the debugger, the ESI register contains one of the LDR_MODULE pointers, while if it is running with the debugger – contains an unspecified value that does not point to a correct memory region. So it causes an exception which terminates the program exeution.
To see if our suspicions are correct, before the exception-generating instructions you can load ESI with any value that points to the correct address in process memory (a readable address). The program will continue with its execution, deobfuscate its code and proceed to perform its main function – to communicate with other nodes of P2P networks and CC servers. You can also verify it by setting the environment variable _NO_DEBUG_HEAP, which disables the heap-analysis mechanisms, before staring debugger.
Summary
Let’s summarize our findings. Protection of the sample analyzed is based on use of an incorrect algorithm for browsing the list of system structures – modules loaded by the process. The popular error was “used” to subject the execution of the protected bot code to the presence of a debugger. Instead of simply checking the presence 0xFEFEFEFE and 0xABABABAB strings, which would be quickly identified by the analyst as a test for the presence of a debugger, the author used the corrupted algorithm and its high sensitivity to changes in the environment that debugger introduces. This is a very subtle and innovative approach and can resist analysis attempts for a long time. Luckily we managed to break it eventually and continue our research on Kelihos.B. We will share our future findings on our website.
