CloudEye (originally GuLoader) is a small malware downloader written in Visual Basic that's used in delivering all sorts of malicious payloads to victim machines. Its primary function is to download, decrypt and run an executable binary off a server (commonly a legitimate one like Google Drive or Microsoft OneDrive).
At the time of writing this article, the malicious code can be split into two parts:
- The core of the program that performs VM checks, downloads the code, decrypts and runs it
- A small wrapper that hides the core by encrypting it with a simple xor algorithm
While the outer layer is pretty tiny and straightforward, mimicking it and manually unpacking the core can be a bit of a headache. In this article, we'll explain how one can leverage IDA Pro functionalities to simplify this process.
Sample analysed:
- ZAPYTANIE_OFERTOWE_KPM_03-022021.exe -
41b83b01b84f95653e2cc9467a6d509c291ab6e834bdf786e75616d51ad45164(VirusTotal, MWDB)
The first thing you want to do while reverse-engineering Visual Basic binaries in IDA is grab a copy of vb.idc. It's a super useful IDA script that parses the embedded VB metadata and provides you with much more information about the binary than the original analysis.
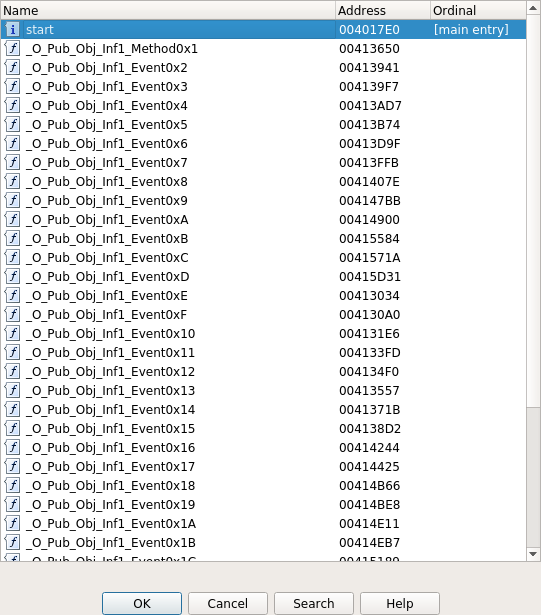
Compare the number of detected event entry points before running the script:

And after:
Locating the malware entry point is still not trivial, though. You can iterate over all discovered entry points and judge if there's anything suspicious or not, but that can become quite tedious, and you can still miss some better-hidden code.
Sometimes, a good method is to search for all add instructions and find the "odd one" with a large immediate value sticking out. You can do that in IDA either by selecting Search -> Text or if you're aspiring to be a power-user: by quickly tapping Alt+t.
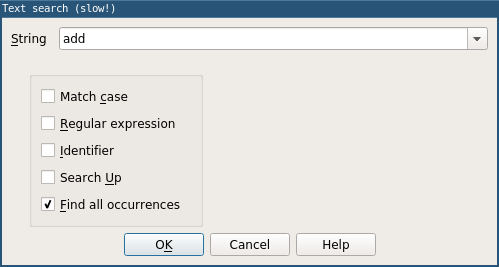
Make sure you check the Find all occurrences box, this will take IDA a bit longer, but it will allow you to inspect all matches at once.
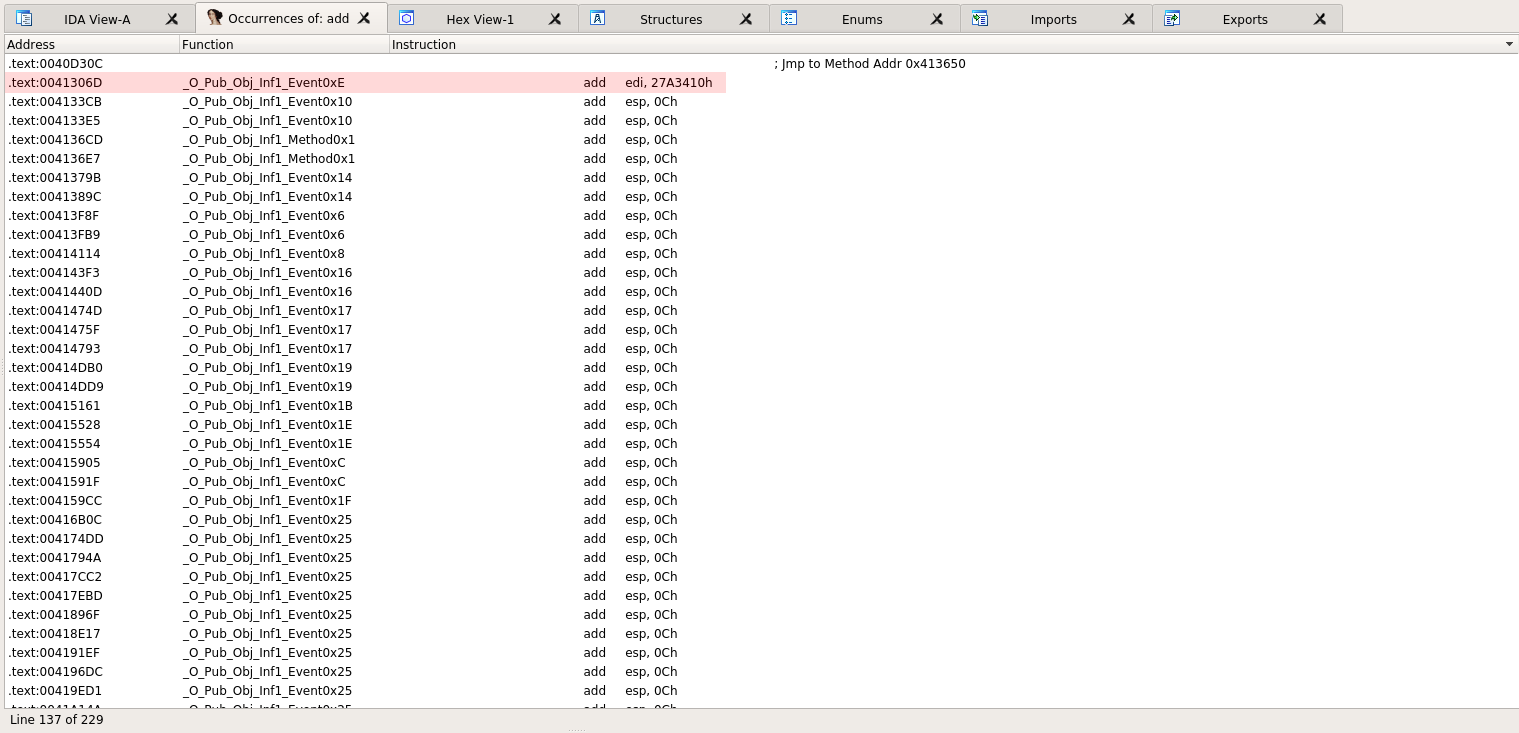
Now, navigate to the function in question:

And press tab to see the matching decompilation (as usual, the decompiler does most of the job for us):
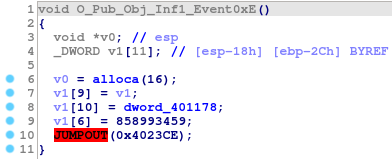
With the malware entry address 0x4023CE we can now begin analyzing the real loader.
Let's jump to the entry address by selecting Jump -> Jump to address (shortcut g)
Surprisingly, there's no code there, just a bunch of data.
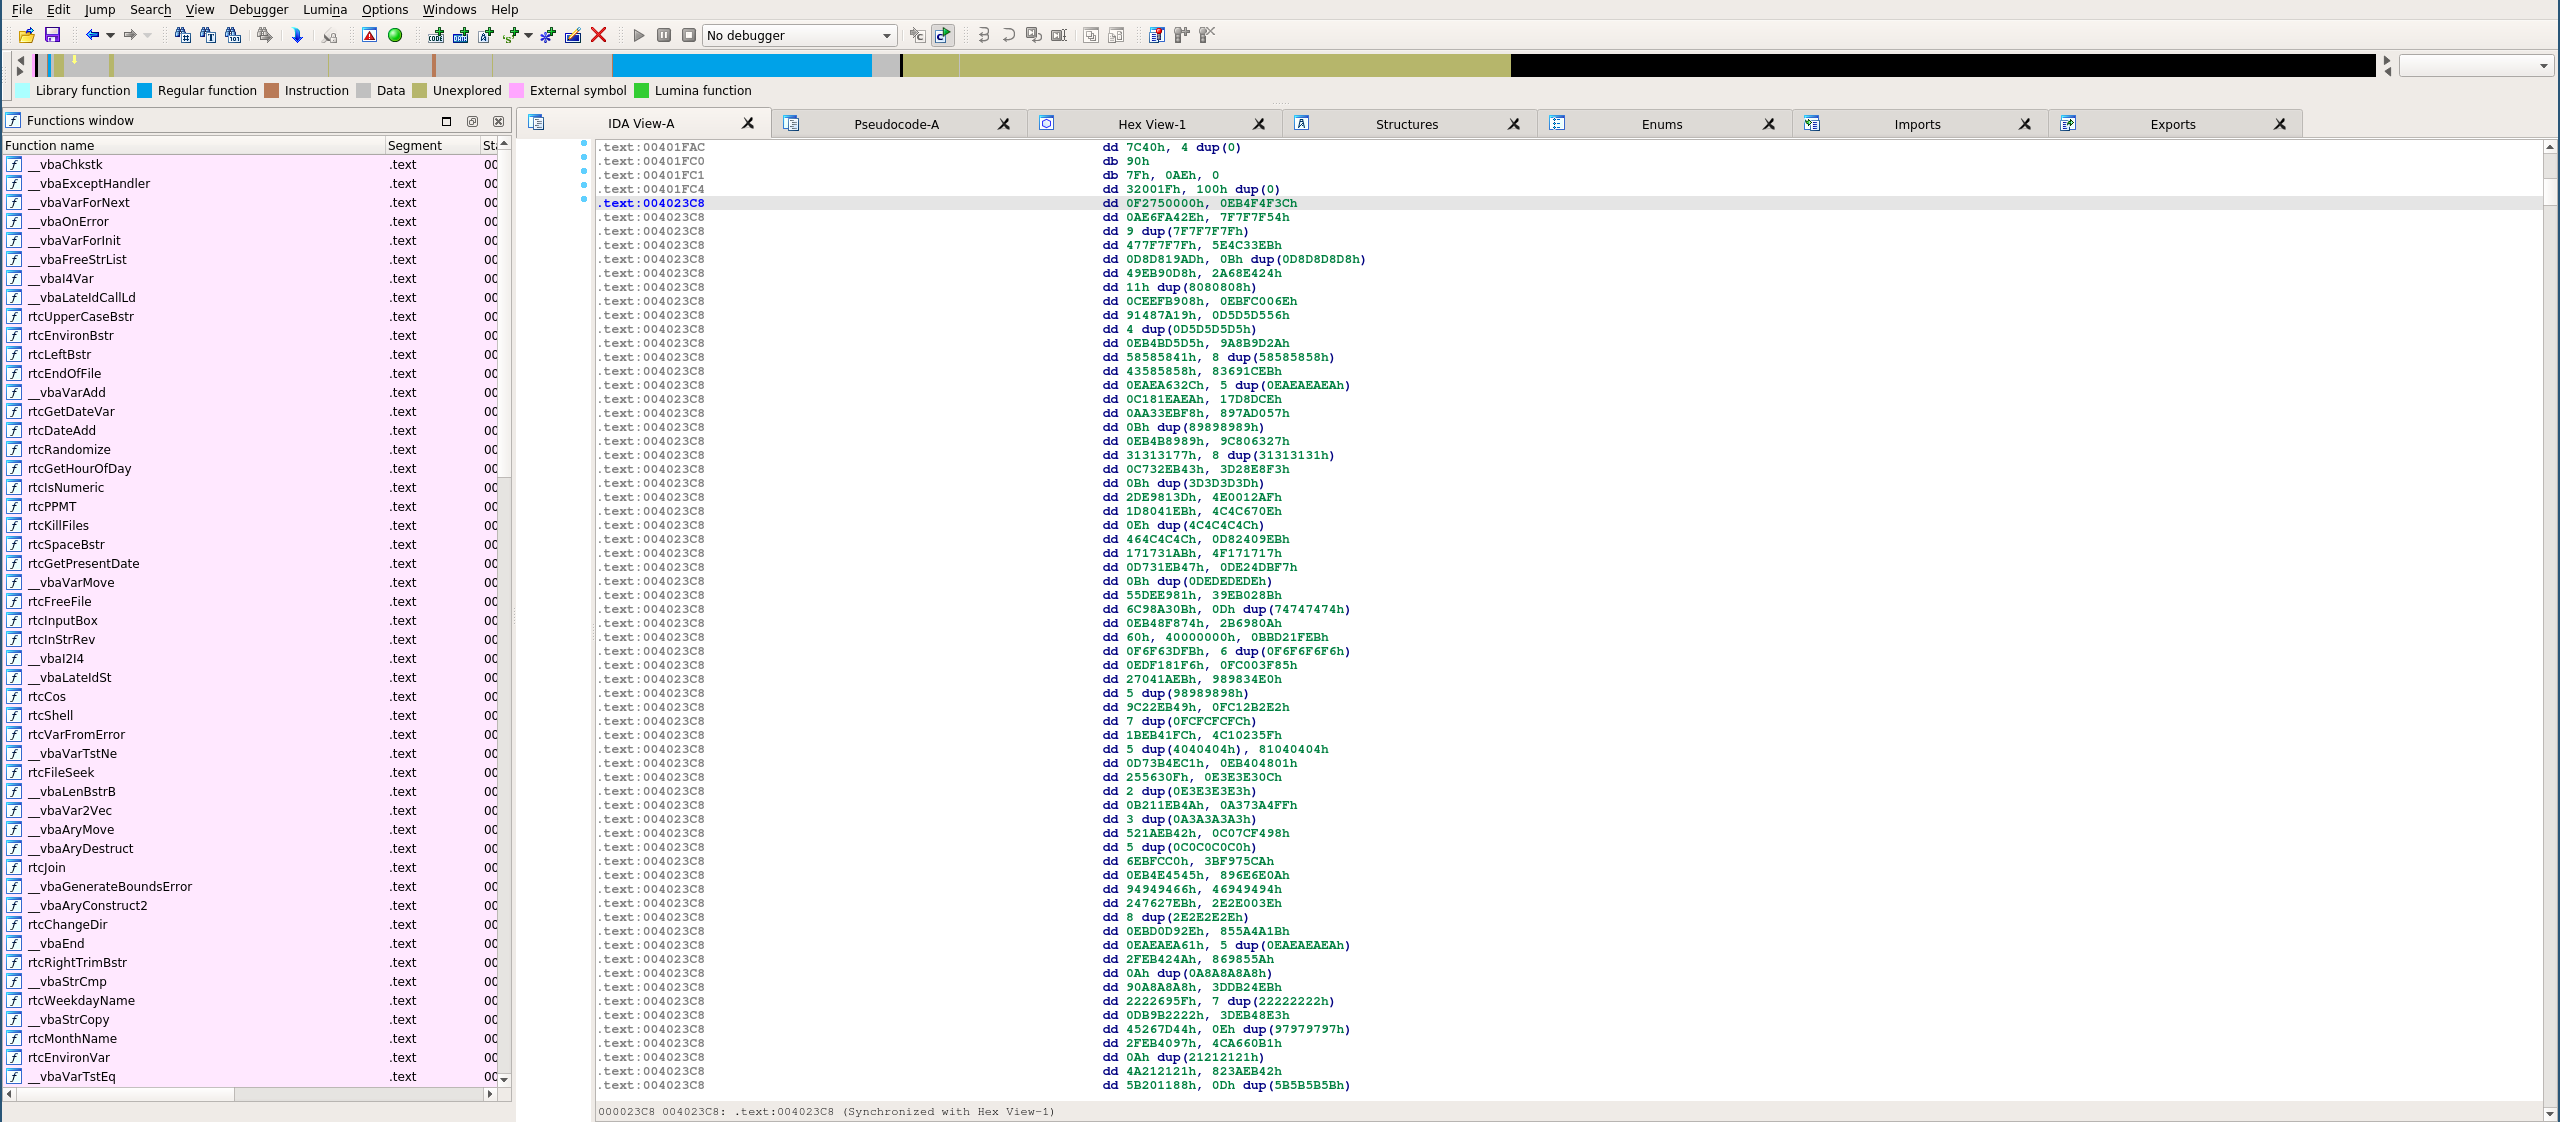
That's because IDA didn't know to follow the code reference; to fix that, we'll have to mark the data as code ourselves. Start by undefining the fragment Edit->Undefine (shortcut u)
This will split the large chunk of data into single-byte lines:
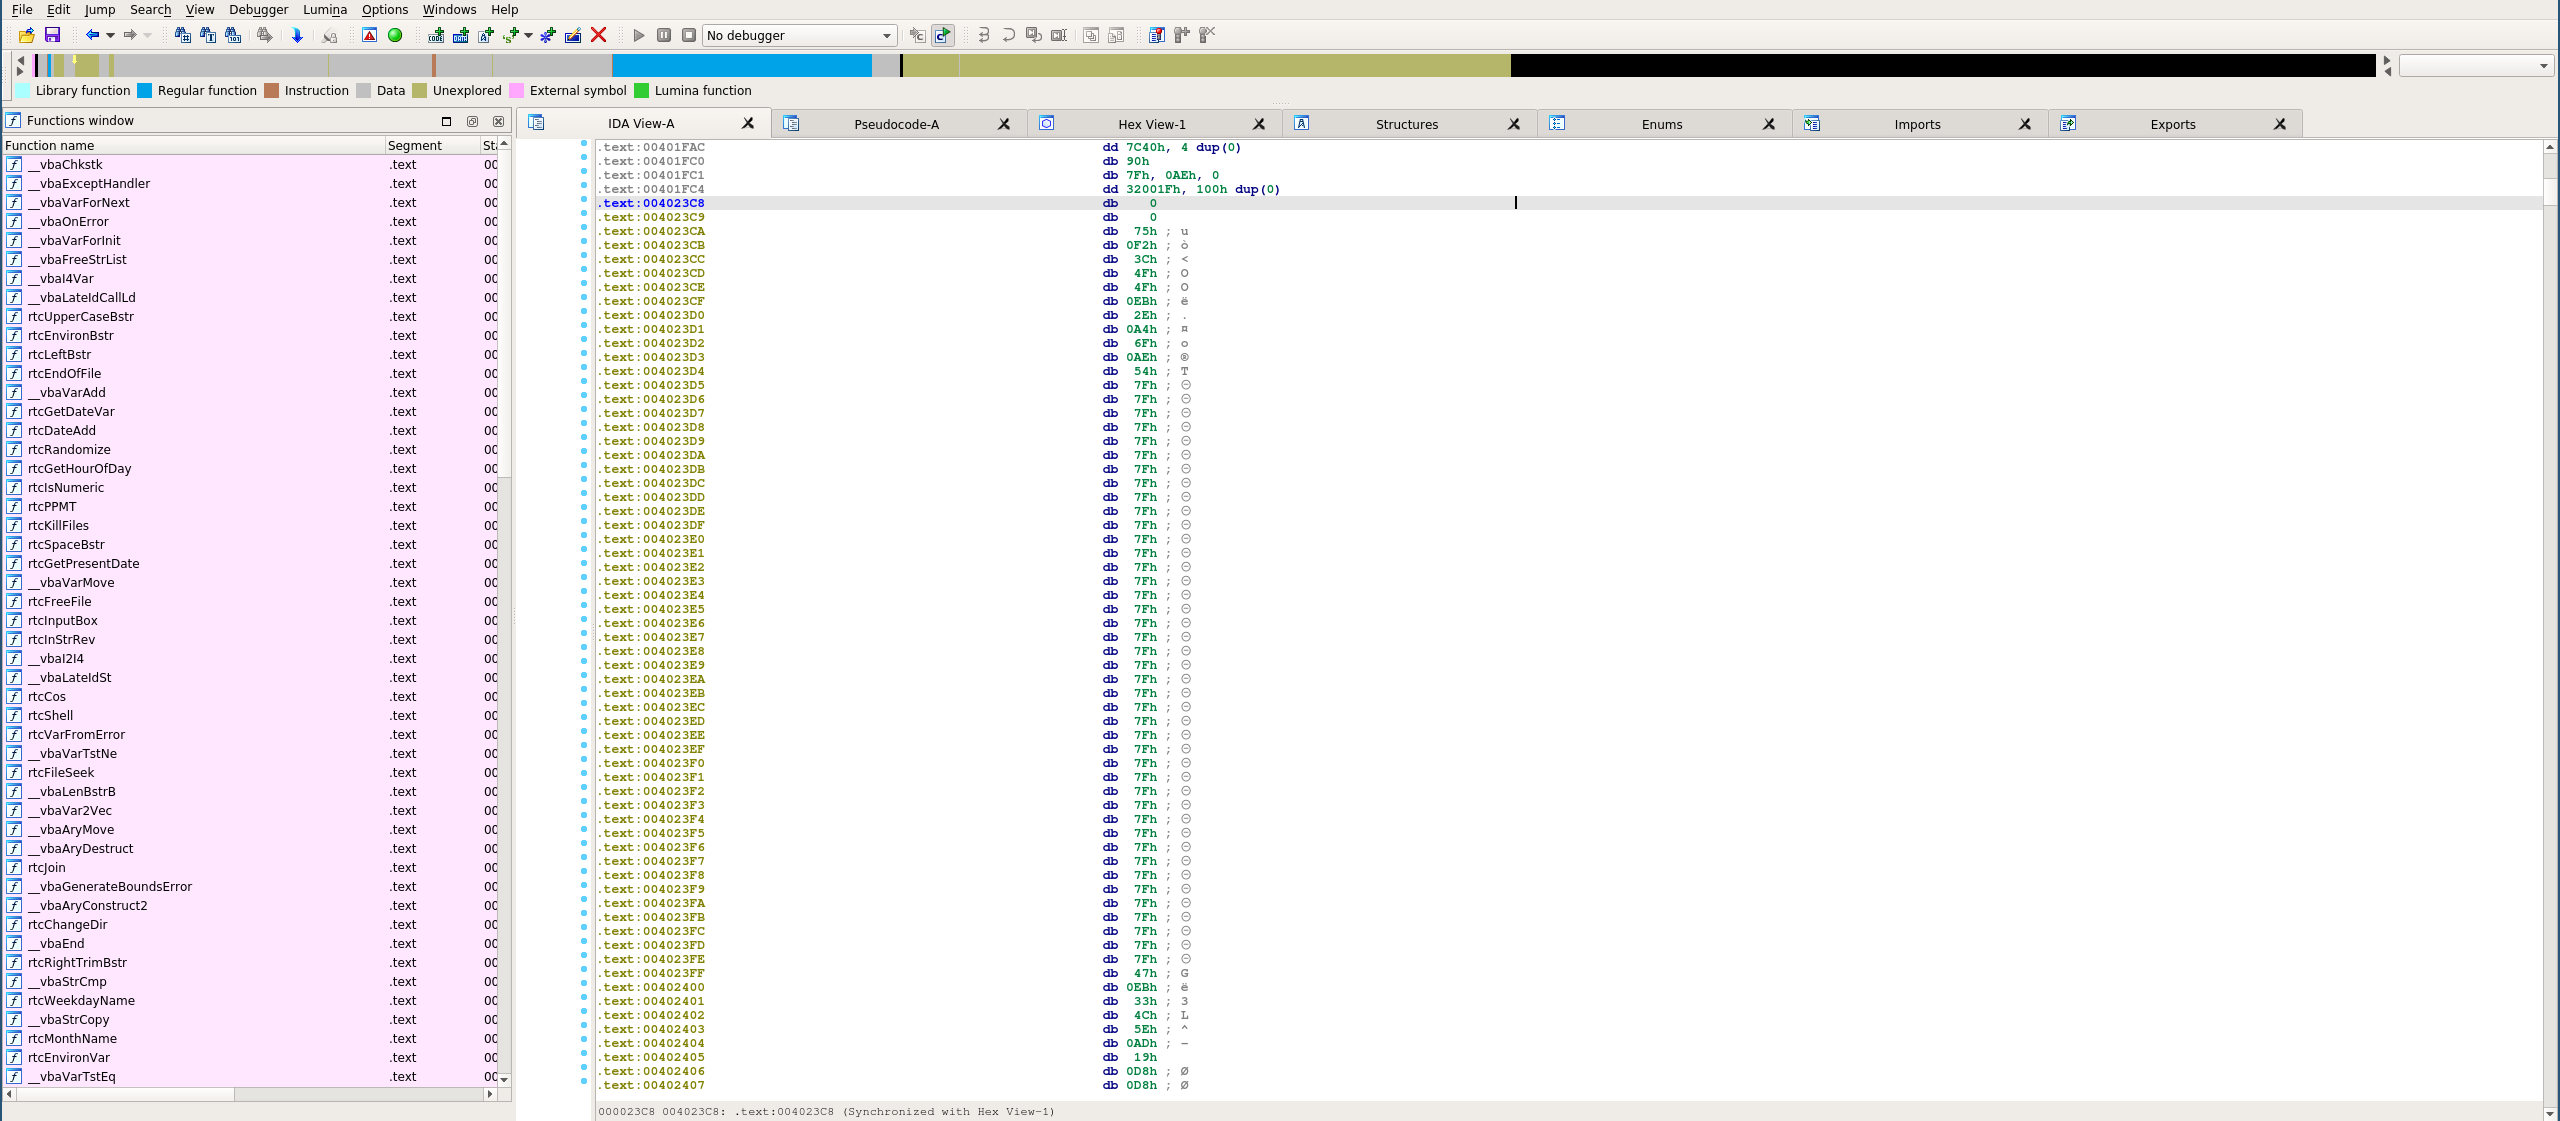
Now we can once again jump to 0x4023CE (the original line contained many bytes, and IDA doesn't know which one to follow and decides to stay on the first byte) and mark the data as code Edit->Code (shortcut c).
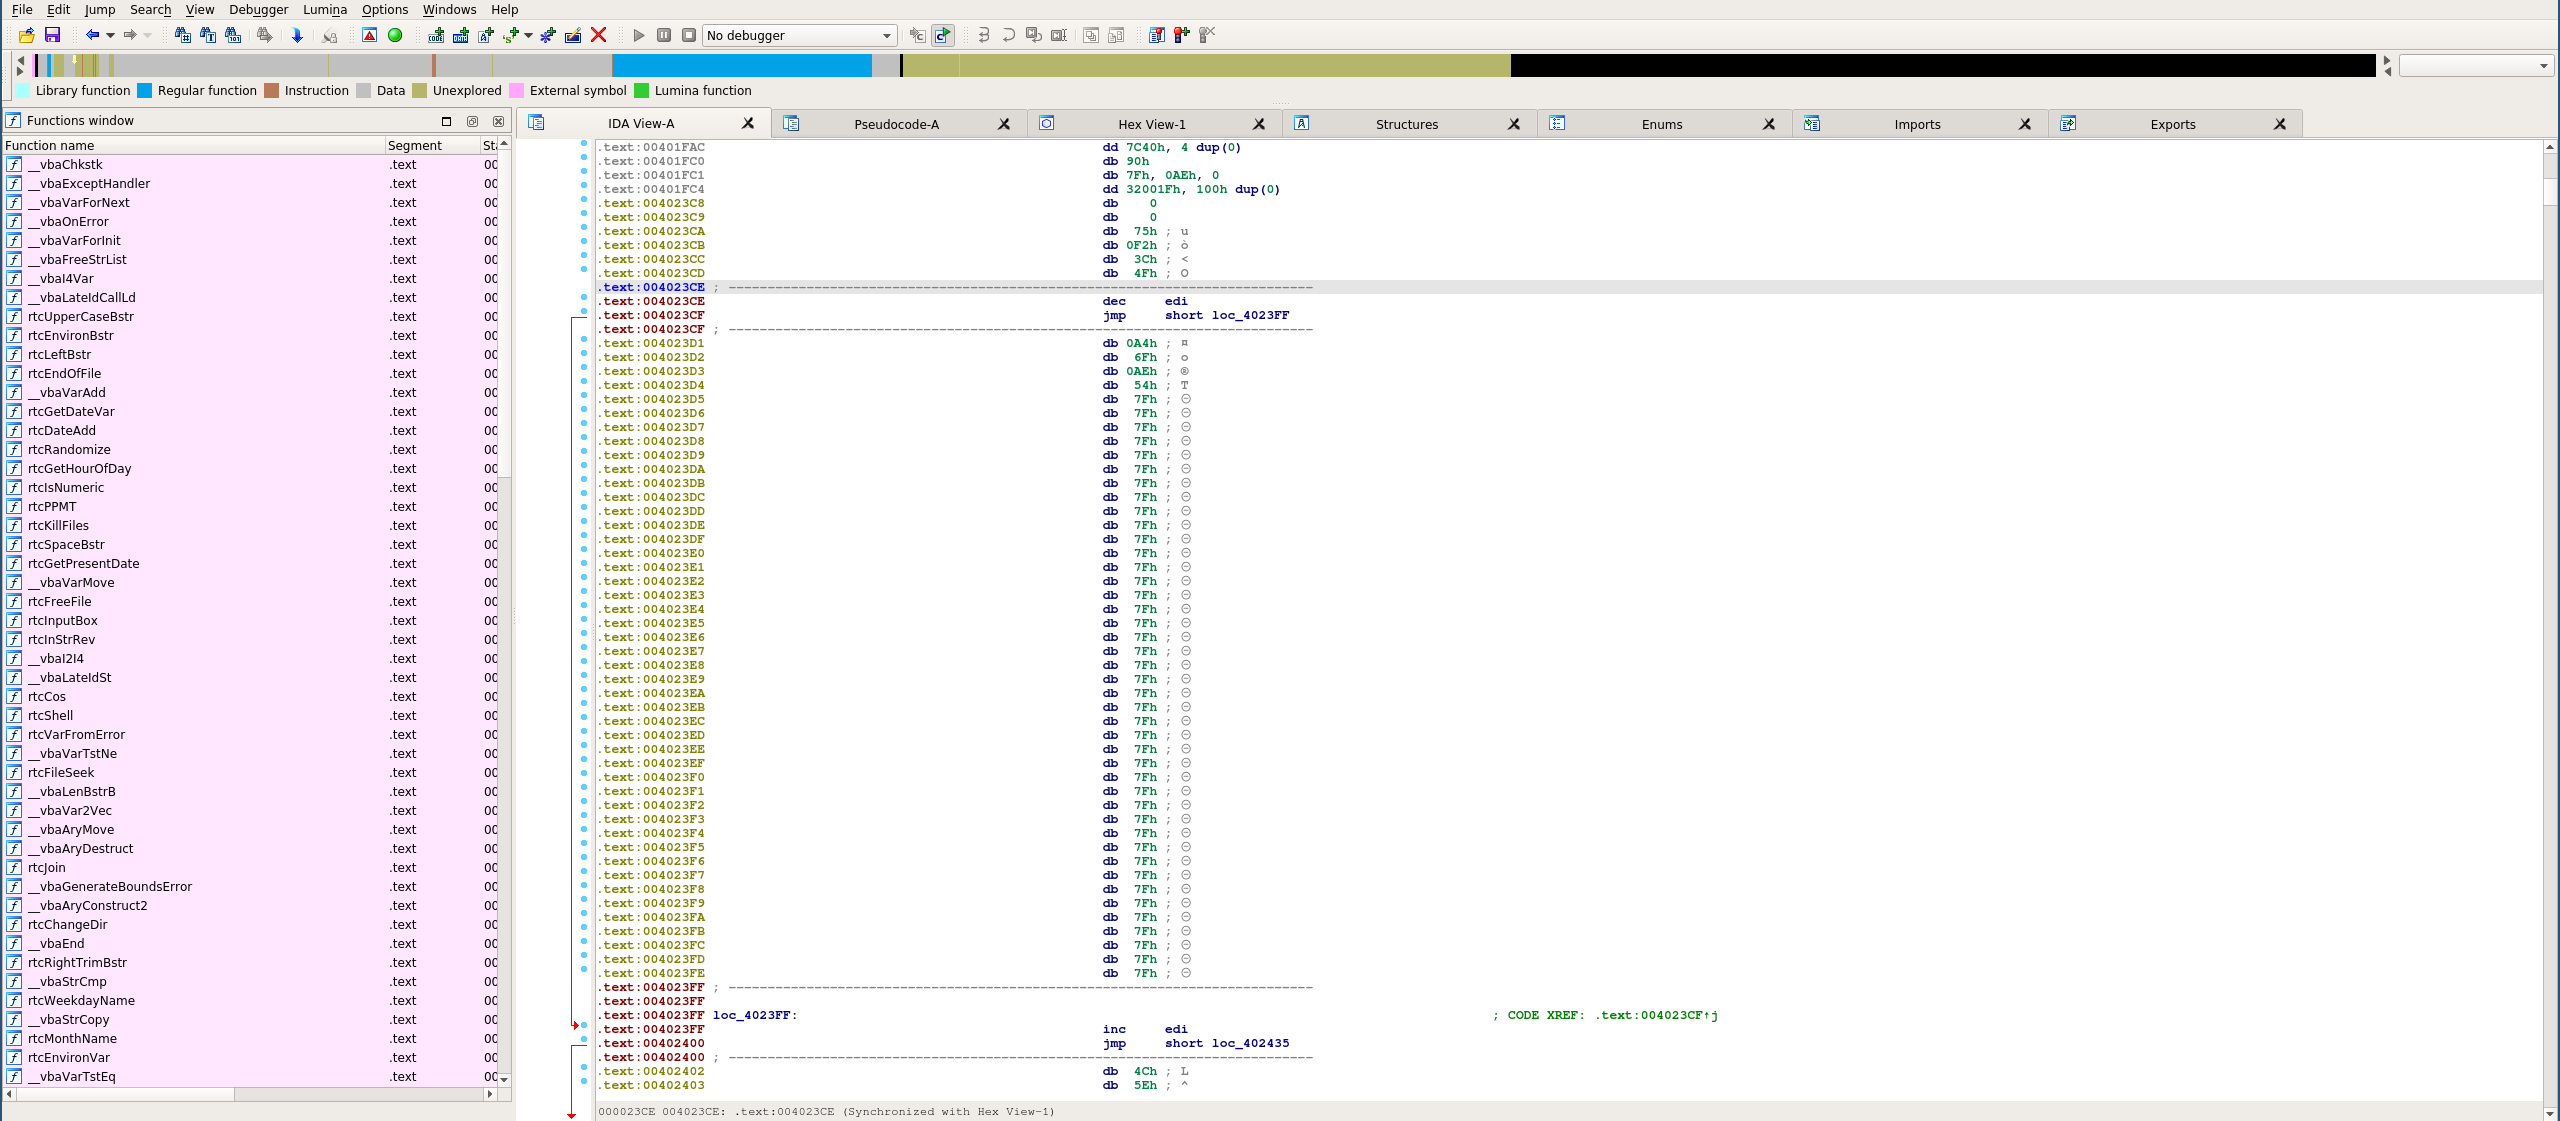
This will automatically disassemble all reachable code blocks and functions.
We can almost immediately notice that this isn't an ordinary function, but something rather weird is going on: there are many jumps with random data between them. We can clear it up a bit by grouping the data between code blocks together and adding a few arrows:
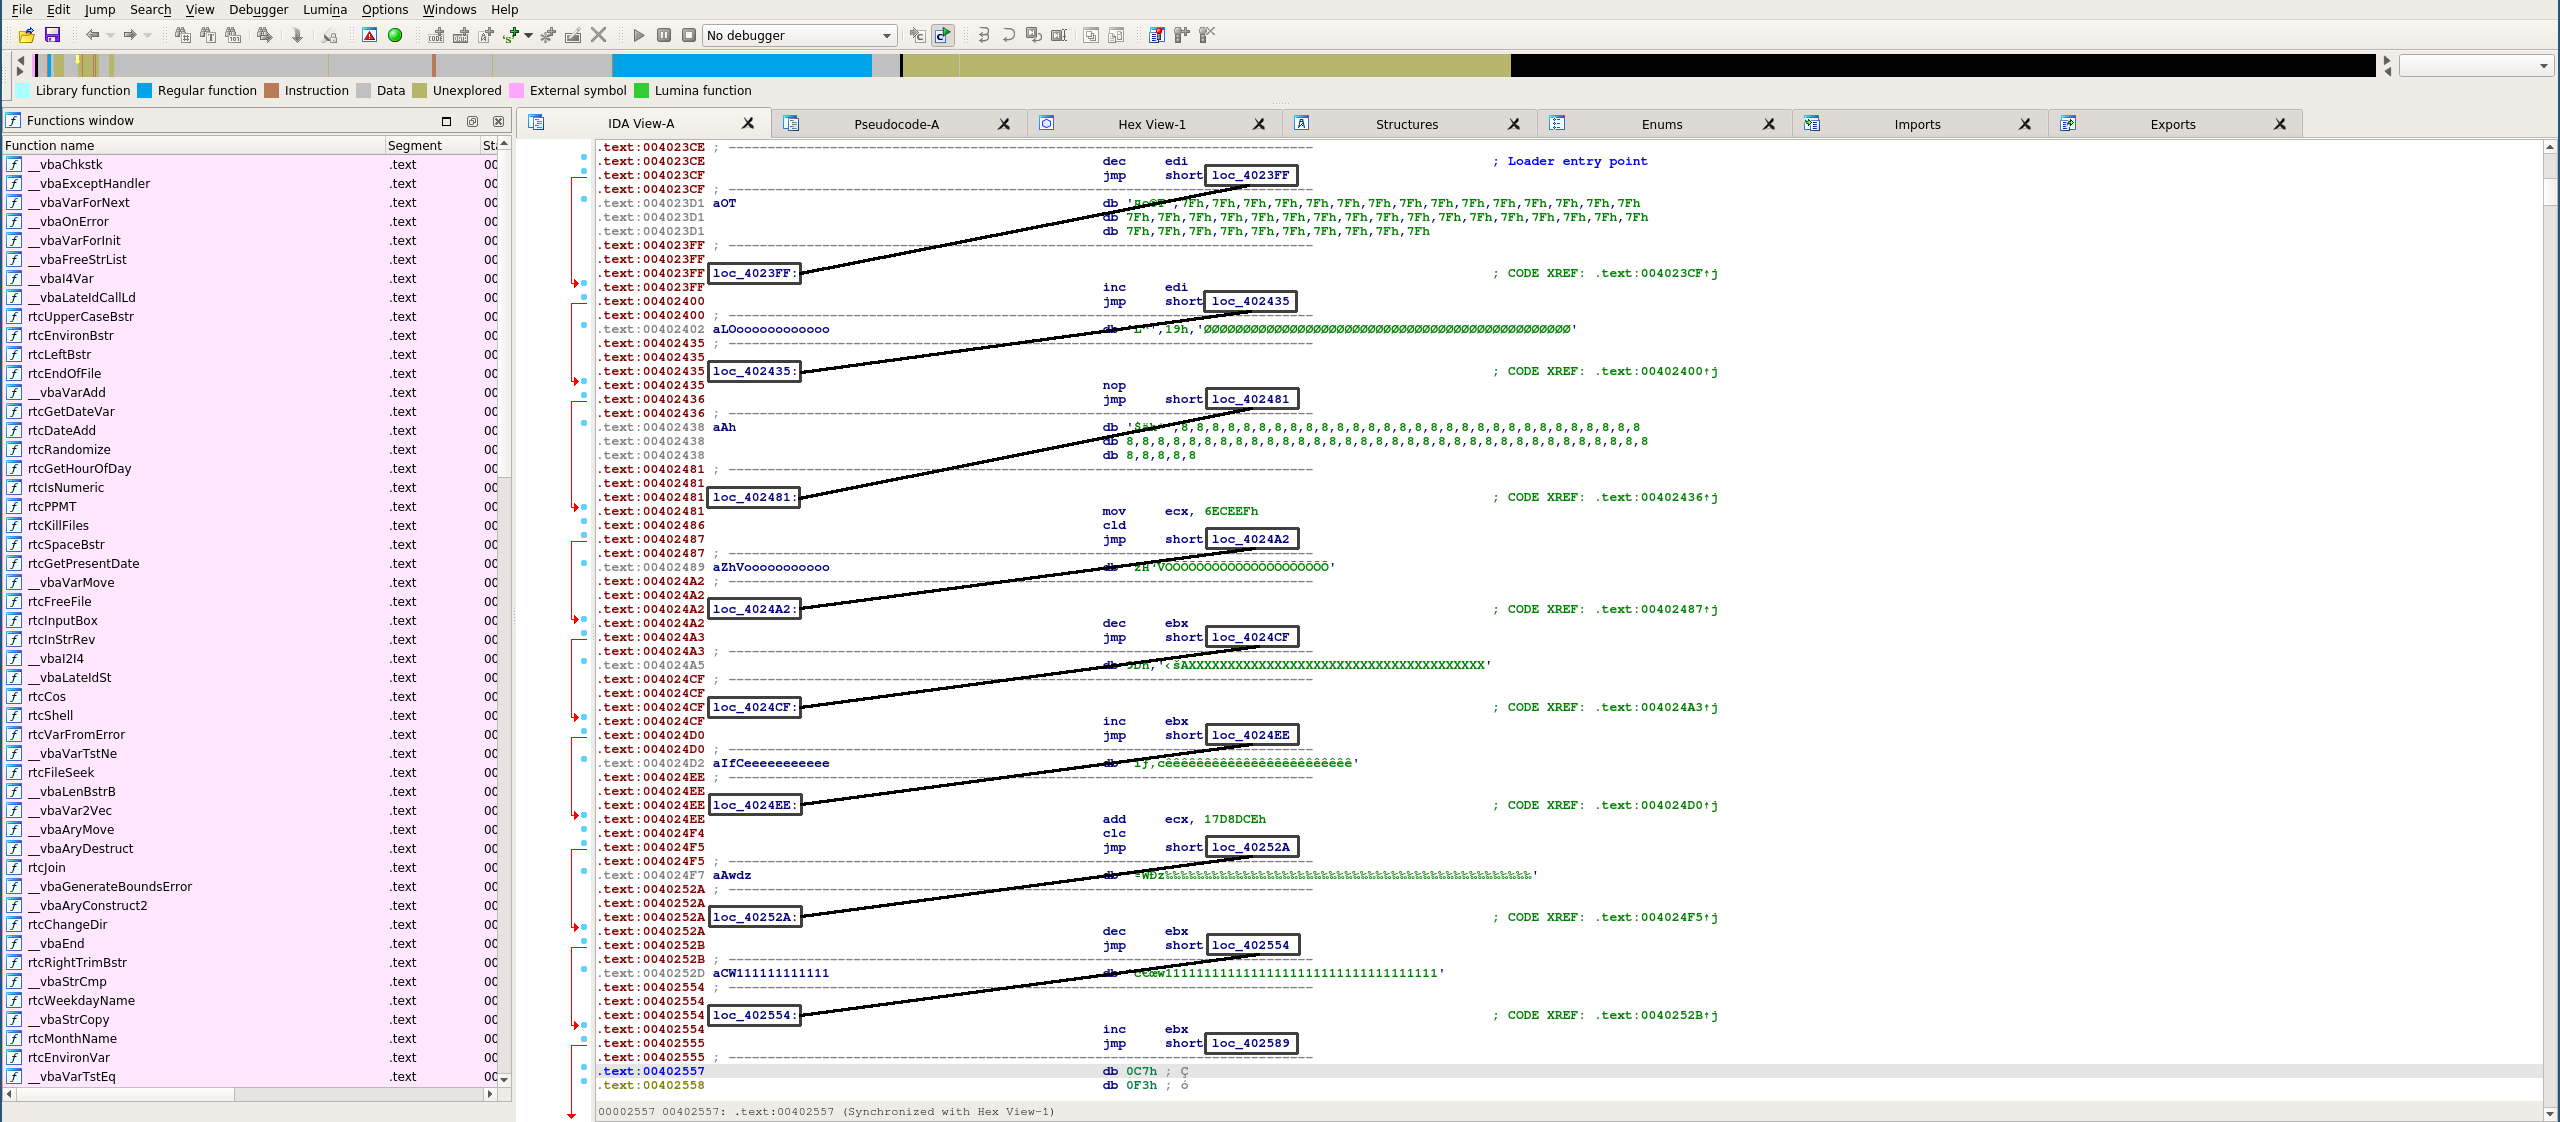
Some of our avid readers will surely recognize this pattern from our Dissecting Smoke Loader article. The main takeaway was that while manually reconstructing the code flow and creating a new disassembly is possible; usually, the best method is to let IDA decompiler deal with such obfuscations.
But if we try to create a new function at the start address (Edit->Functions->Create Function shortcut p), all we get is this annoying error message:
.text:00402FEE: The function has undefined instruction/data at the specified address.
Your request has been put in the autoanalysis queue.
That's because IDA wasn't able to disassemble the code at the given address; let's see what the fuzz is about.
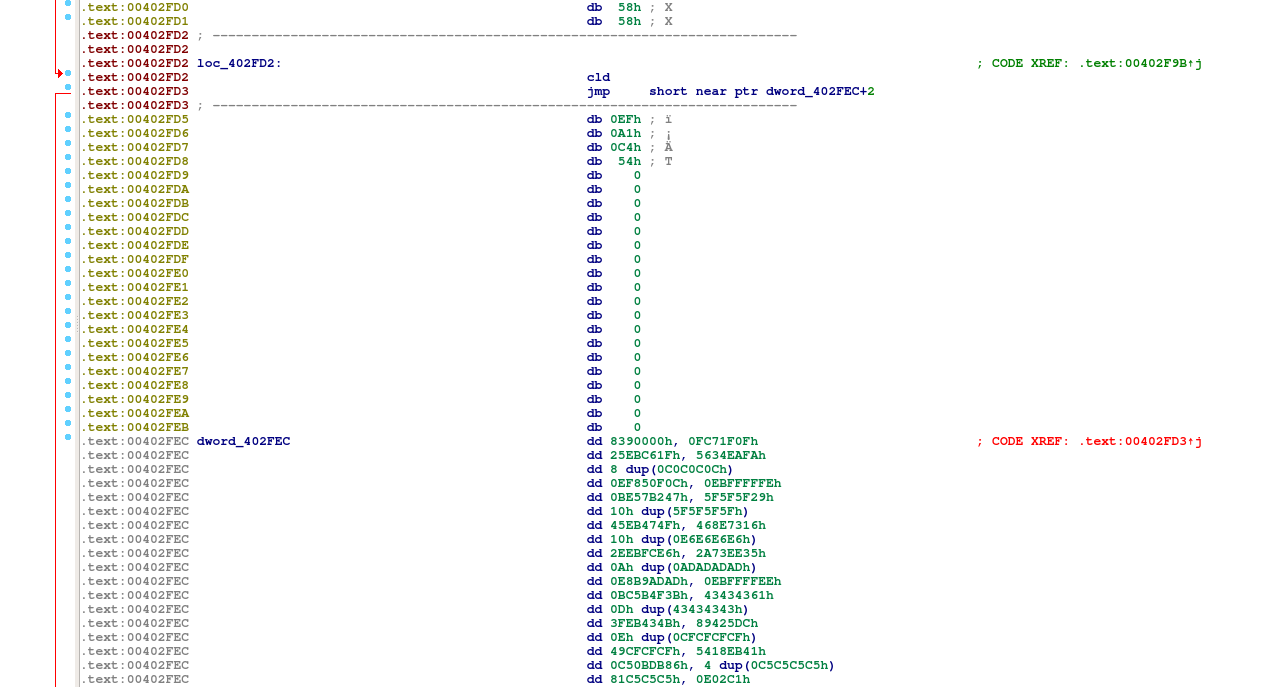
Well, yes, it doesn't look too correct. Instructions in the form of jmp short near ptr <addr>+<number> should almost always raise a red flag for you. It very often means that the jmp (or any other code-flow-altering instruction) tries to jump into the middle of already defined code/data. In this case, though, it looks like IDA just made an error, and we have to mark the data as code manually, similarly as we had done previously.
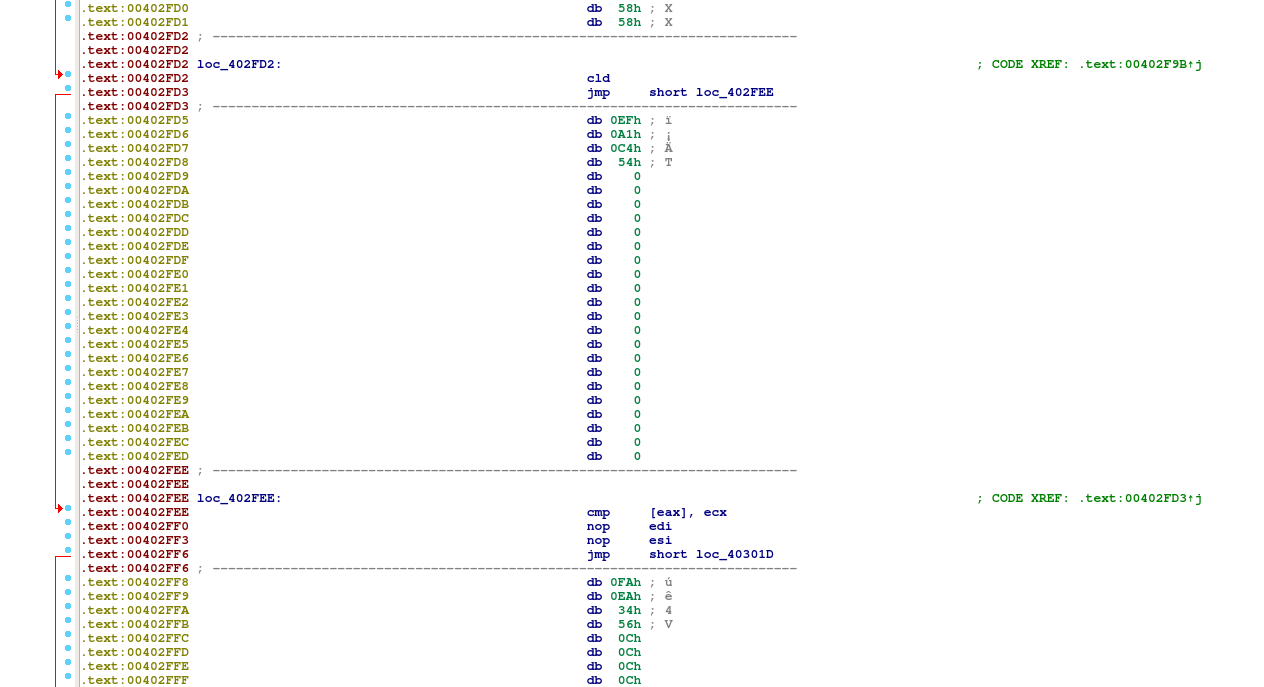
Good as new! We may have to repeat this several times before we get all parts correct.
At some point, though, we'll come across a fragment that no longer looks like correct x86 code:
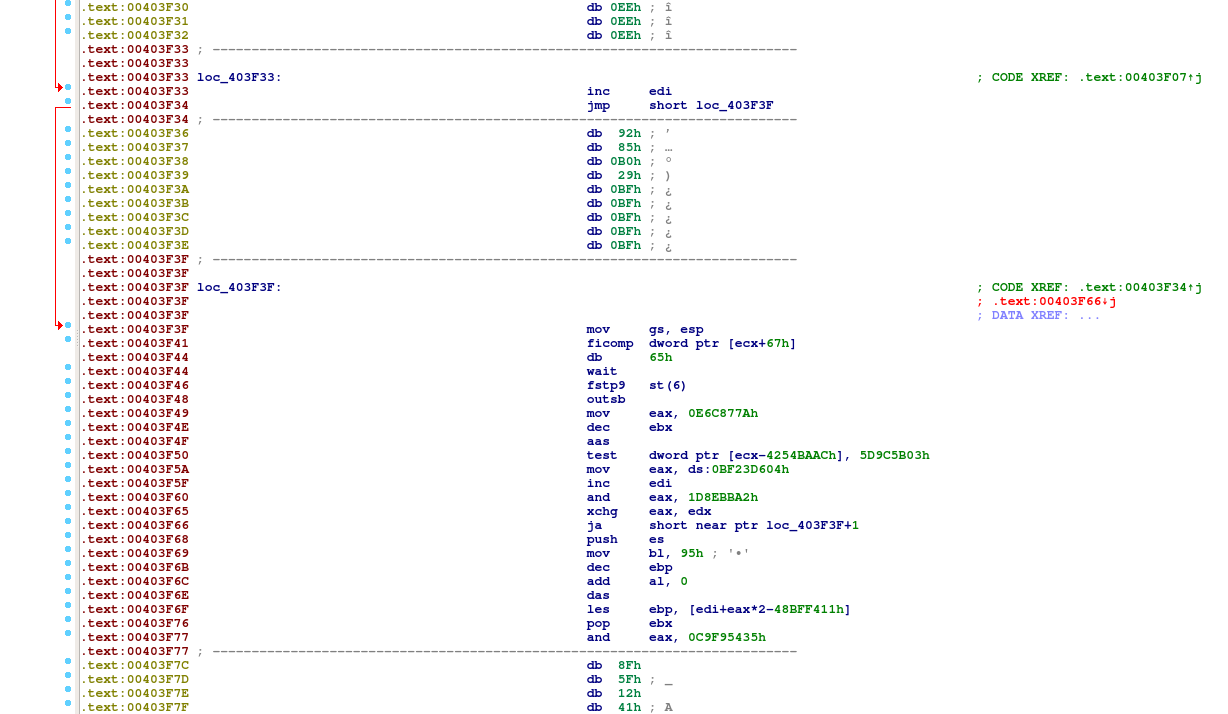
That's the code that gets decrypted in previous code blocks; naturally, IDA won't decompile invalid instructions. We can get around that using (at least) 2 methods:
- by selecting the code segments, we want to include in our newly-created function
- by patching the last
jmpinstruction toret, which will cut off the last invalid block from our function
We'll go with the first method as it's a bit more elegant and simple; for any adventurous readers the Edit->Patch program menu and a good x86 opcode reference (like http://ref.x86asm.net/coder32.html) should be more than enough to try out the other method.
Selecting the whole memory range by dragging the mouse is a bit boring and can sometimes deselect the selected code on its own. We'll use the Edit->Begin selection (shortcut Alt+l) command. Position the cursor just before the final jmp instruction, begin the selection, go to the loaders entry point (0x4023CE) and create a new function.
If everything goes correctly, the relevant fragment in the sidebar should change its color to blue:

-->

And you should be able to tap Tab and view the simple decompilation pseudocode:
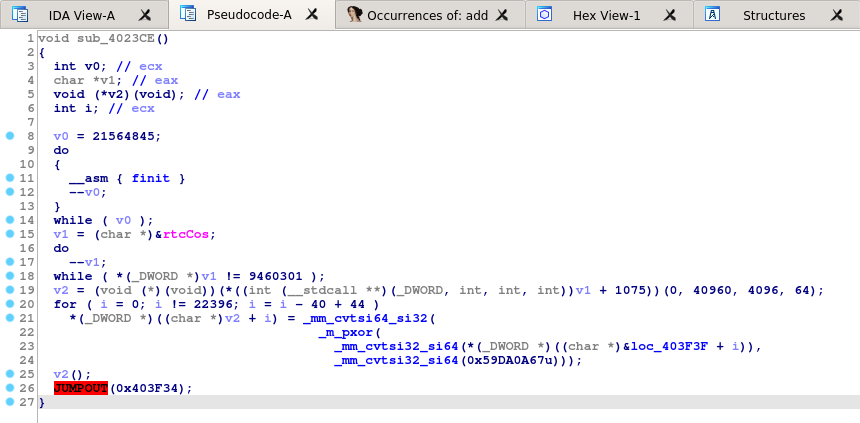
The logic is actually quite simple, but the code can get much more bloated and confusing in other samples.
void sub_4023CE()
{
  int v0; // ecx
  char *v1; // eax
  void (*v2)(void); // eax
  int i; // ecx

  v0 = 21564845;
  do
  {
    __asm { finit }
    --v0;
  }
  while ( v0 );
  v1 = &rtcCos;
  do
    --v1;
  while ( *v1 != "\x90ZM" );
  v2 = (*(v1 + 1075))(0, 40960, 4096, 64);
  for ( i = 0; i != 22396; i = i - 40 + 44 )
    *(v2 + i) = _mm_cvtsi64_si32(_m_pxor(_mm_cvtsi32_si64(*(&loc_403F3F + i)), _mm_cvtsi32_si64(0x59DA0A67u)));
  v2();
  JUMPOUT(0x403F34);
}
Going step by step:
v0 = 21564845;
do
{
  __asm { finit }
  --v0;
}
This is a simple sleep snippet, nothing super interesting there.
v1 = &rtcCos;
do
  --v1;
while ( *v1 != "\x90ZM" );
v2 = (*(v1 + 1075))(4300, 0, 0, 40960, 4096, 64);
This is a bit more interesting, it fetches the pointer to rtcCos from MSVBVM60.DLL and then iterates downrange to find the images base address. It then uses that address to calculate a function address by adding 1075 to the pointer.
If we load the dll in IDA and navigate to the fetched address (0x732A0000 + 1075 * 4) we can learn that it's VirtualAlloc.

So this is all just a sneaky a way of calling it without clearly indicating it in imports. Let's move on.
for ( i = 0; i != 22396; i = i - 40 + 44 )
  *(v2 + i) = _mm_cvtsi64_si32(_m_pxor(_mm_cvtsi32_si64(*(&loc_403F3F + i)), _mm_cvtsi32_si64(0x59DA0A67u)));
This part copies 22396 bytes from 0x403F3F into the newly allocated buffer dexoring it with the constant 0x59DA0A67 in the process.
We can get the decrypted core without debugging the binary using a short Python script:
import struct
from malduck import xor

data = xor(key=struct.pack("<I", 0x59DA0A67), data=get_bytes(0x403F3F, 22396))
with open("decrypted.bin", "wb") as f:
    f.write(data)
And finally, the program jumps into the newly copied buffer.
v2();
Tune in next time to the second part, where we'll describe some of the CloudEyE's functions and discuss how we can extract the download URLs and the encryption key from unpacked samples automatically using Malduck.
